Financial Data Store (FDS) Reports Training Guide
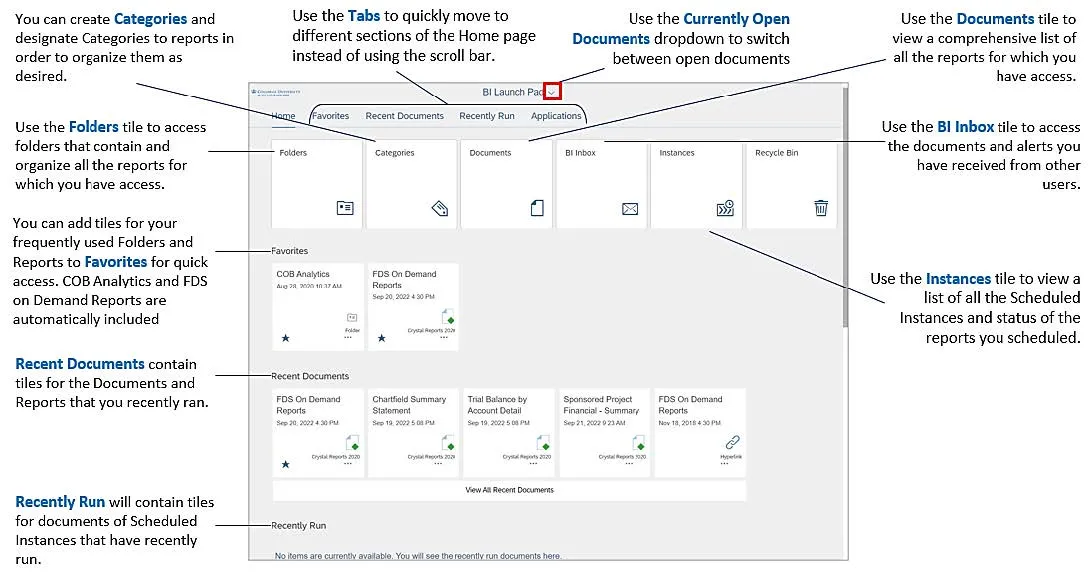
This Training Guide details how to navigate the Business Intelligence (BI) Launch Pad in order to access FDS reports. The BI Launch Pad has a tile interface with easy access to On Demand reports, Consolidated Operating Budget (COB) Analytics reports, Favorites and Recent Documents.
Last Revision: August 2026
Navigating the BI Launch Pad
To access FDS, go to my.columbia.edu, click the ARC tab, and then click on the Go to FDS icon.
Details
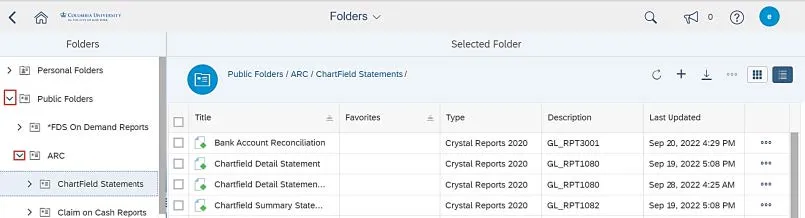
- Click the Folders tile. The Folders screen appears.
- Navigate by expanding Public Folders and the ARC folder. Select the subfolder containing your desired report.
- Click the desired report Title to Enter Values for parameters and run the report.
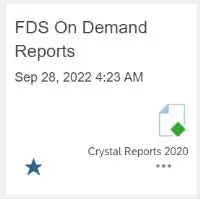
- Click the FDS On Demand Reports tile. (You can also navigate to the Folders tile > Public Folders > FDS On Demand Reports folder > FDS On Demand Reports.) The FDS On Demand Reports page appears.
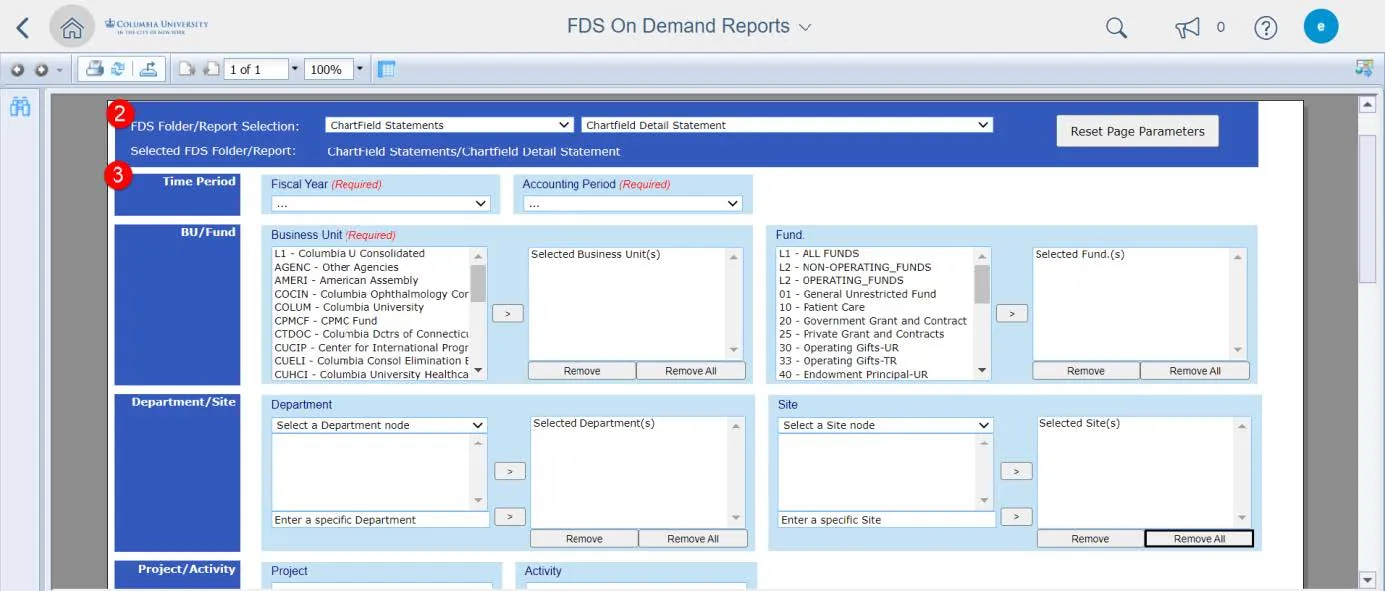
- Select a Folder/Report from the respective drop downs for the report you want to run. The Parameters Page appear.
- Enter the Required parameters, indicated with red labels, and any optional parameters you desire.
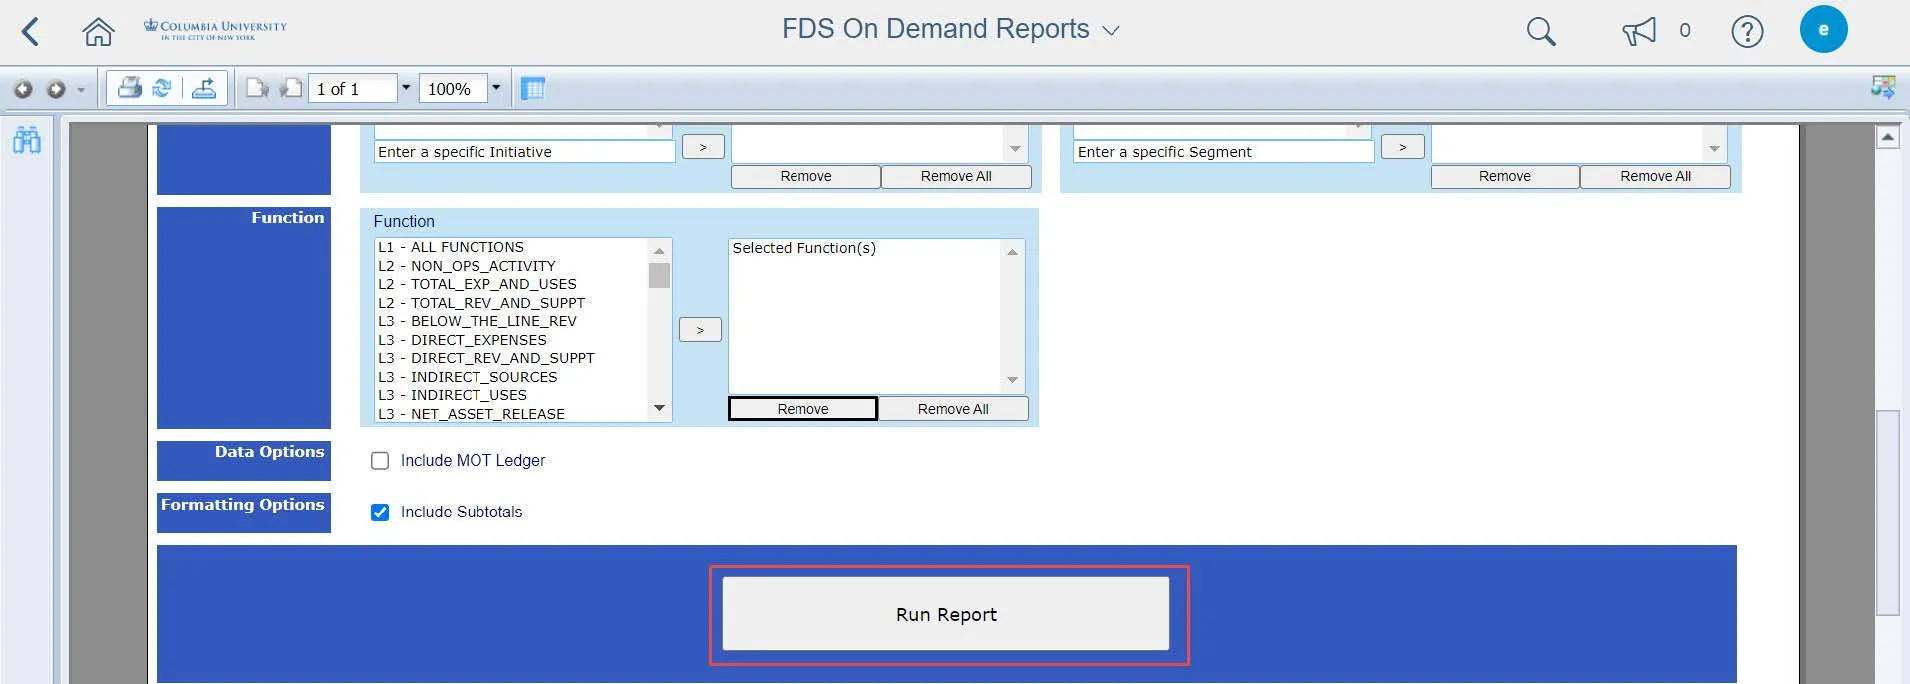
- Scroll to the bottom of the Page Parameters and click the Run Report button.
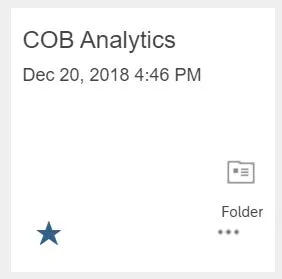
- Click the COB Analytics tile. (You can also navigate to the Folders tile > Public Folders > Cob Analytics folder.) The COB Analytics folder appears with the list of report Titles you can run.
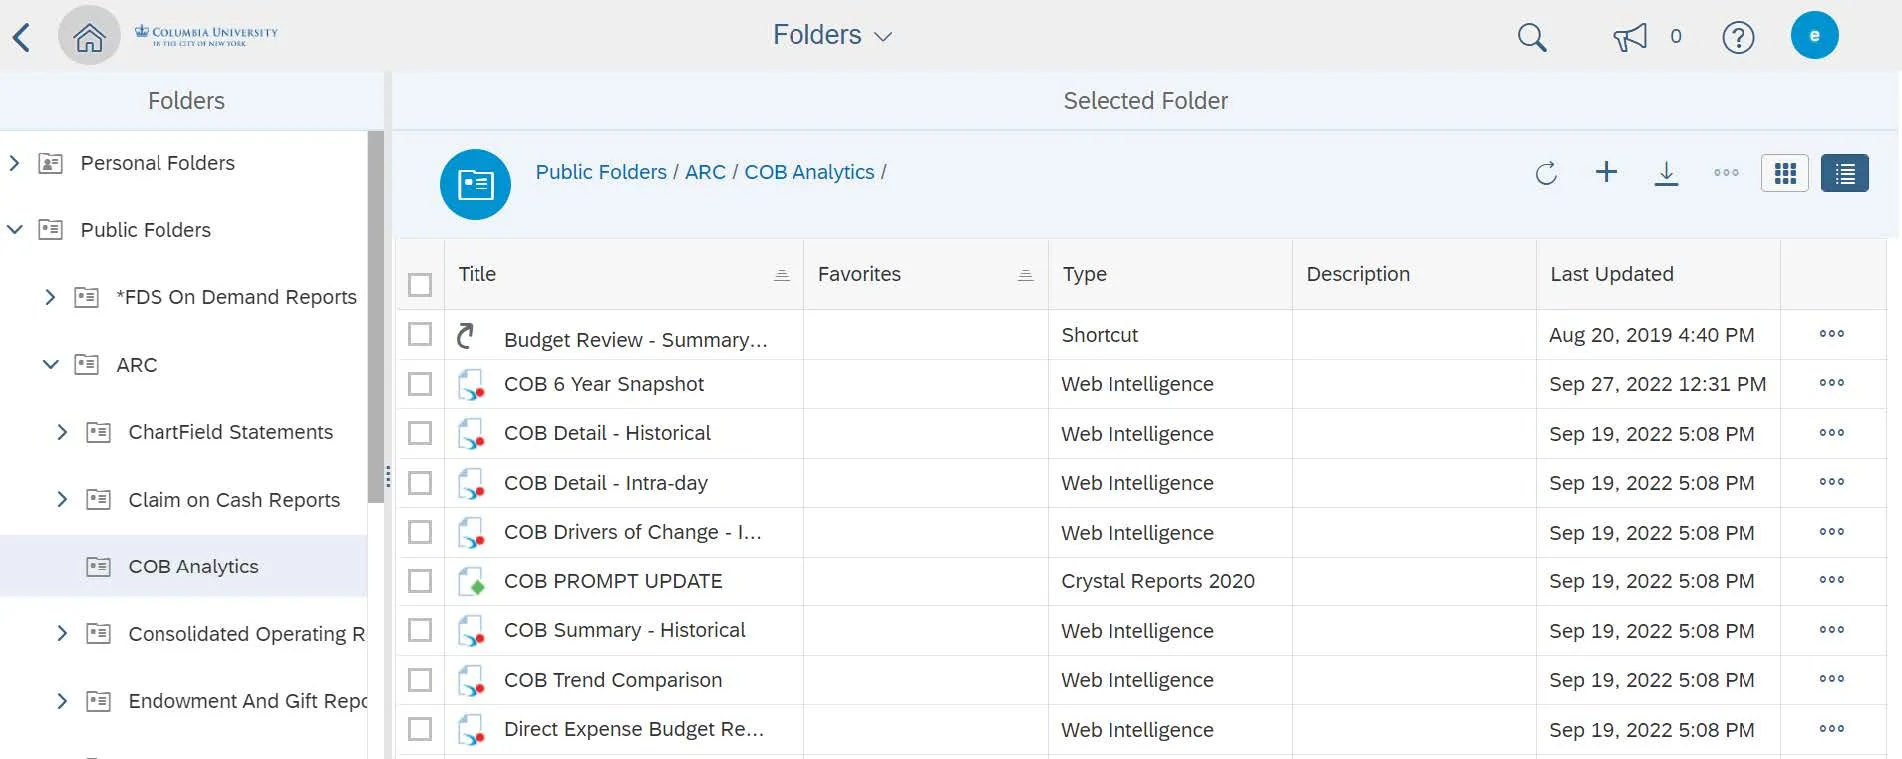
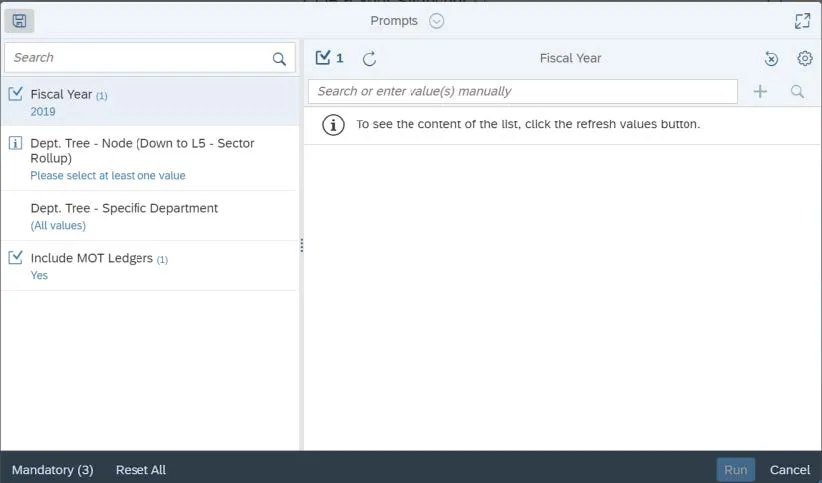
- Click the report Title you want to run. The Prompts window appears.
- Use the pane on the left to navigate to different prompt category sections and enter desired parameters. Required prompts will be indicated with a note to “Please select at least one value.” You cannot run the report until you complete required prompts.
- Click Run. See the section on Web Intelligence (Webi) Features for more details on viewing COB Analytics.
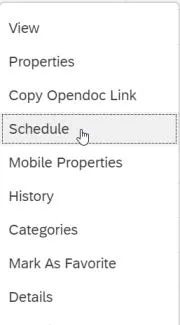
- Click the Actions button for the report you want to schedule and click Schedule. The Schedule page appears.
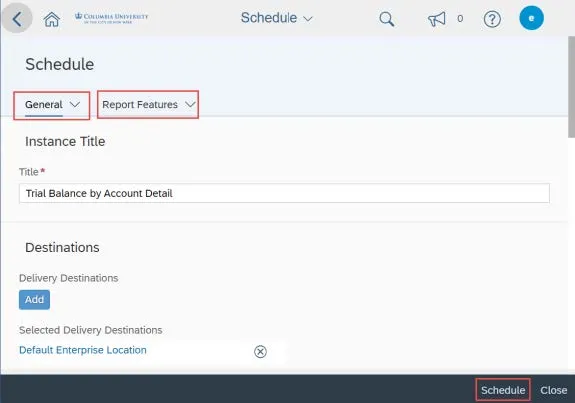
- Complete the Schedule fields.
- The General tab contains sections that define a schedule, like the schedule’s Destinations, Recurrence, Events, and Notifications.
- The Report Features tab contains sections for the report values Prompts, Formats, and Print Settings.
- Click the Schedule button at the bottom of the page.
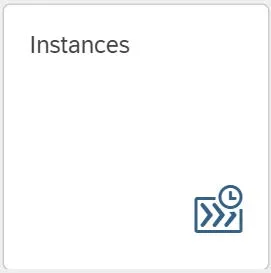
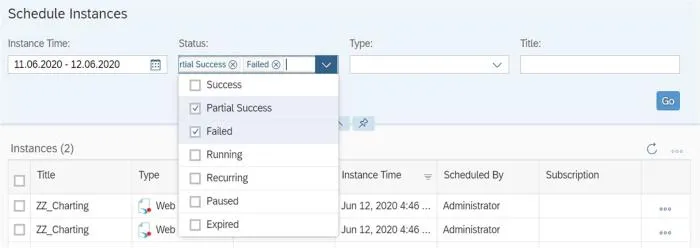
- Click the Instances tile on the Home screen to view your Schedule Instances and their status. You can filter the Schedule Instance page by date, object type, or name. You can also switch between the list view and a calendar view.
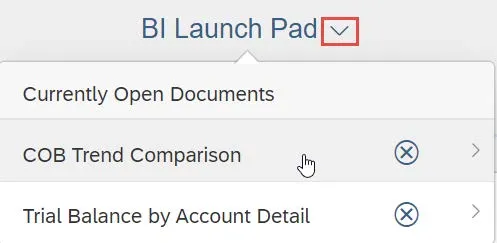
Click the Currently Open Documents dropdown at the top of the screen to switch between documents you have previously run (in the same session) or reports you are currently running.
- Navigate to a Folder or Report that you want to make a Favorite.
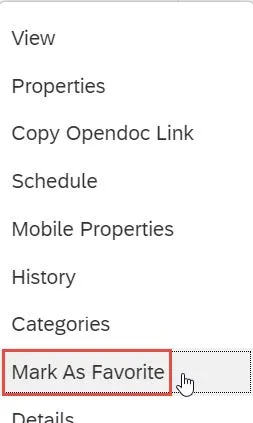
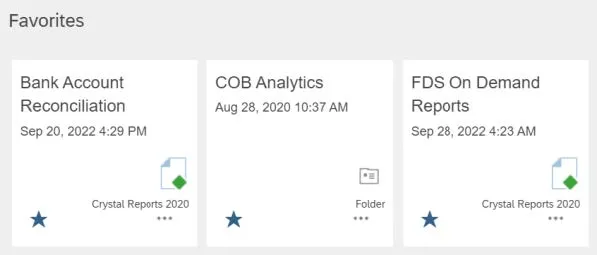
- Click the Actions button for the report you want to make a Favorite and click Mark as Favorite. The Tile for the Folder or Report will appear in alphabetic order under the Favorites section on the Home page.
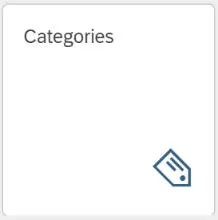
- Click the Categories tile to create a Category to help organize Folders and Reports. The Categories Page appears and lists your previous Categories and any items you categorized.
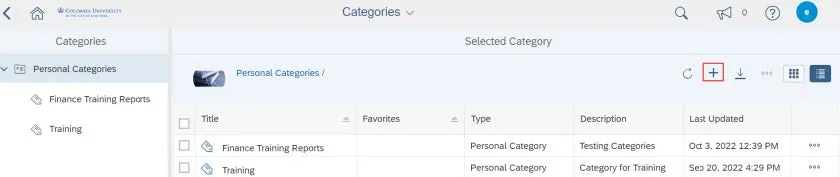
- Click the Create Category button. The Create Category window appears.
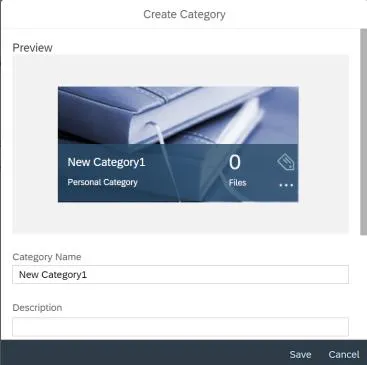
- Enter a Category Name and Description and click Save.
To Categorize a Folder or Report:
- Navigate to a Folder or Report that you want to categorize.
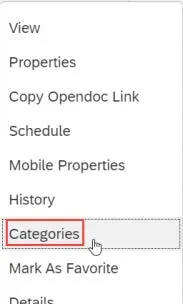
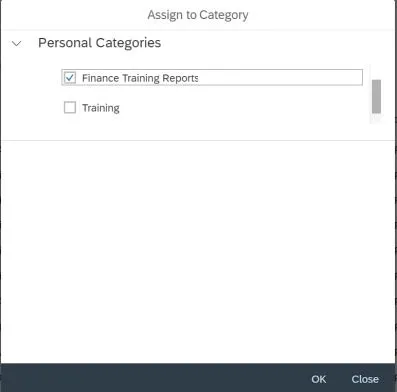
- Click the Actions button for the report you want to categorize and click Categories. The Assign to Category window appears.
- Select the Check Box for the desired Category or Categories. Navigate to the Categories page to view.
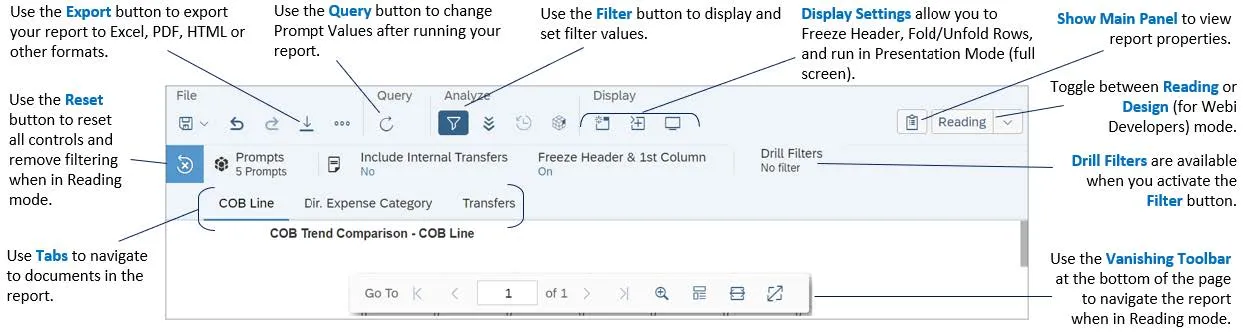
COB Analytics reports utilize Web Intelligence (Webi) to run and display information. Webi comes with features to help you navigate, display, filter, and analyze your data.