Running COB Analytics using Web Intelligence (Webi)
This job aid contains instructions on how to run the Consolidated Operating Budget (COB) Analytics Reports using Web Intelligence (Webi).
Last Revision: June 2026
Details
- Log into My.Columbia, select the ARC tab and click the GO to FDS icon.. The FDS screen appears.
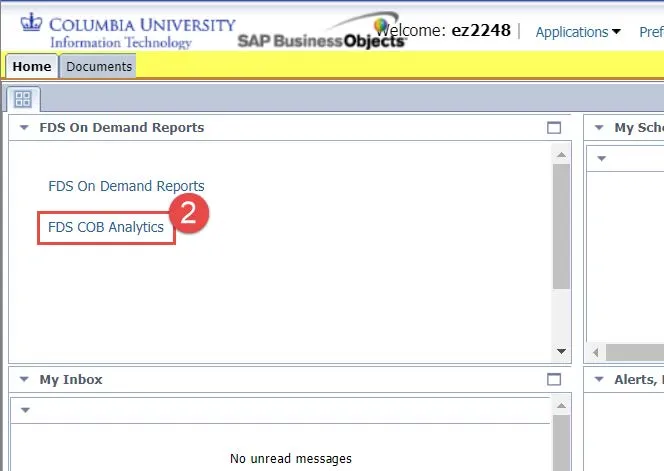
The FDS screen appears.
- Click the FDS COB Analytics.
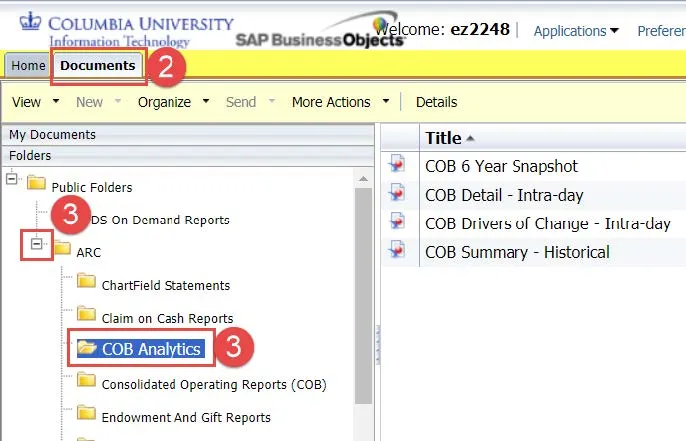
- Double click the desired report Title.
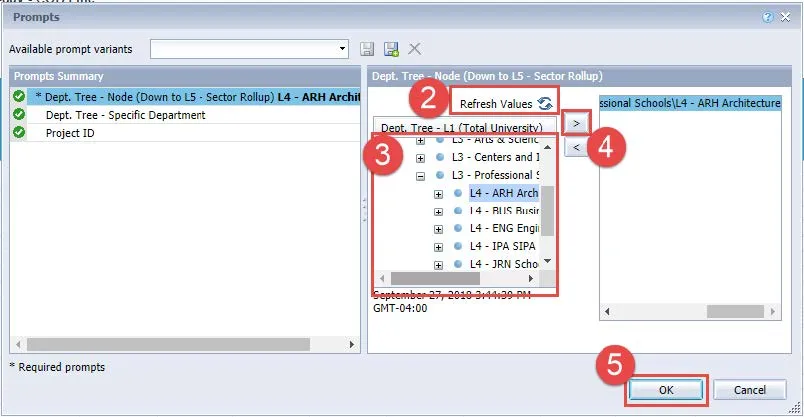
A Prompts window appears.
- Select a Prompt from the left side of the window. Options for entering Values appears on the right side of the window.
- Enter a value manually or click the Reload the list of values icon to view the list of values to select.
- After selecting your Prompts and entering Values, click Run. The selected report will be generated.
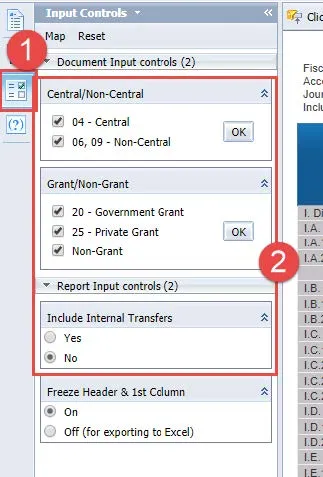
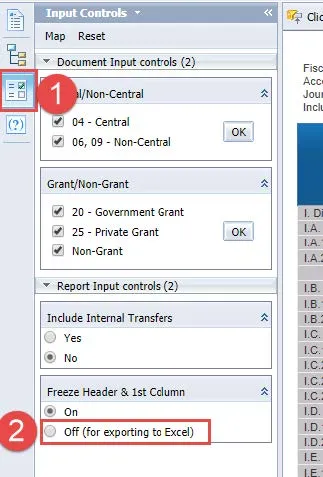
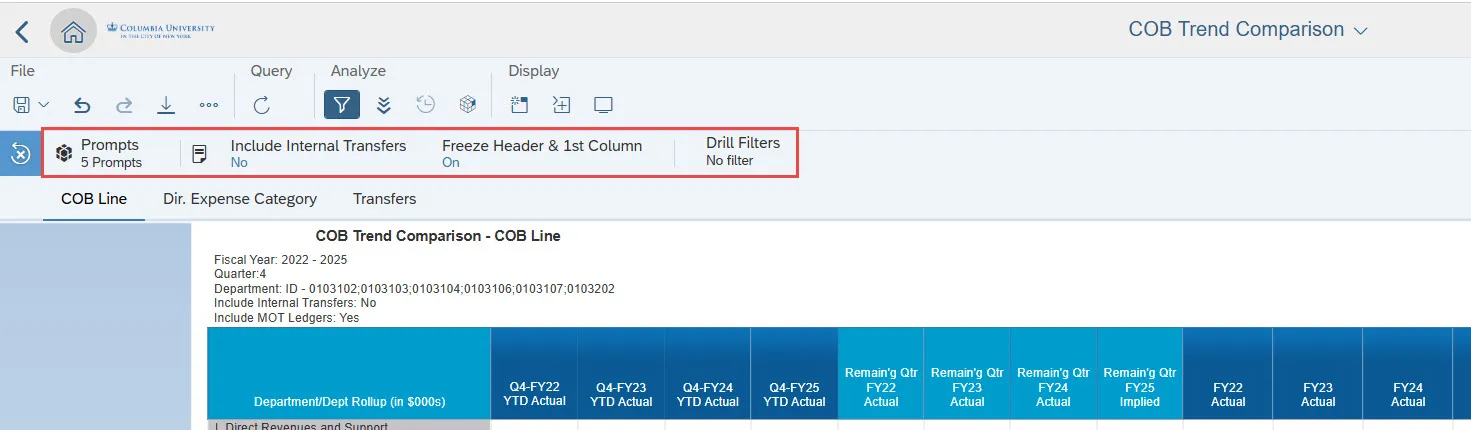
Changing Input Controls and Filter Settings
To change Prompts and to filter the report, click the appropriate setting from the Input Controls toolbar.
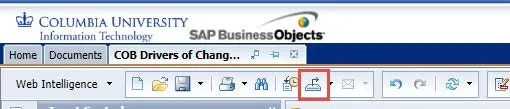
Exporting to Excel
- Click the Export to Excel icon from the top toolbar.
The Export to window appears.
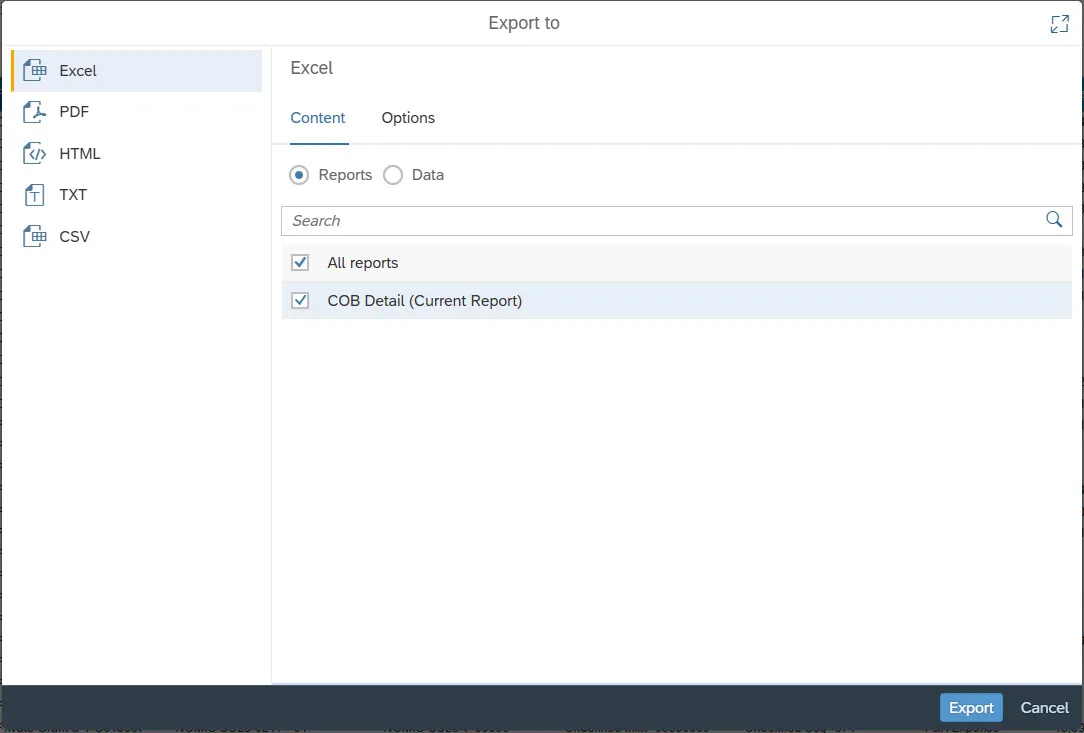
- Select the Content and Options tabs to set preferences.
- Click the Export button.
Adding and Removing Columns
Unlike FDS COB detail reports and other COB Analytics reports, the COB Detail – Intra-day report does not contain all fields by default. You can add columns to the report using the following method:
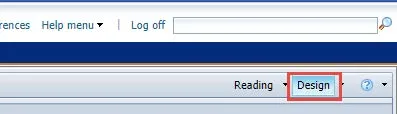
- Select the Design view from the upper right corner of the report window.
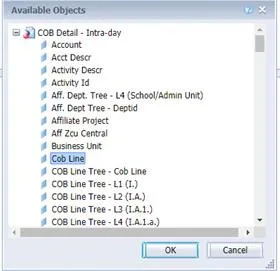
- Select the Show Main Panel icon and then the Show document objects icon..
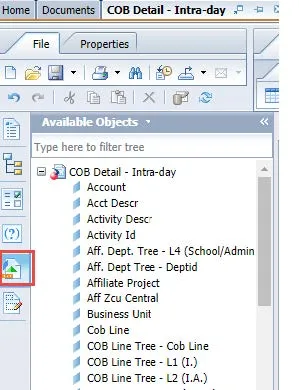
The list of Available Objects appears.
- Drag and drop the desired object to the desired column location in the report.
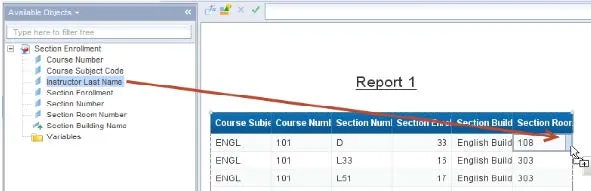
You can drag the object to the right edge or left edge of a column header.
Or, replace a column by dragging the object over the center of the column header.
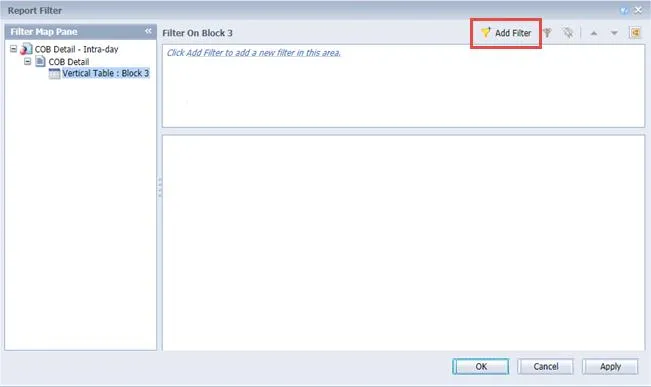
Adding and Removing Filters
- Select the Design view from the upper right corner of the report window.
- Select the Show main panel icon and then the Show document objects icon to display available objects.
- Select the Show properties panel for current-selection icon and select the Display the filter panel icon.
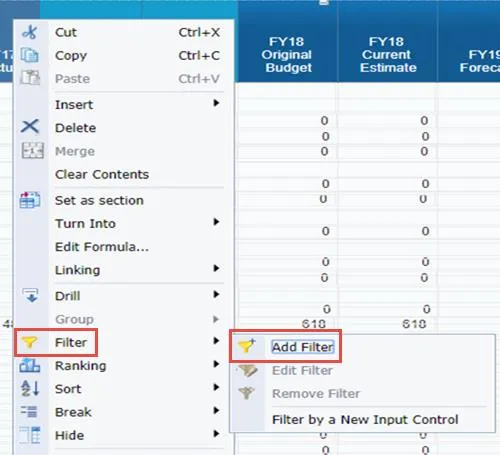
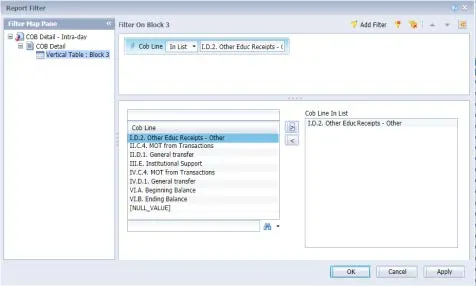
- Drag and drop an object from the object list to the designated location in the Filter By section.
The Select values dialog appears.
- Select the values for which you want to filter the report and click OK. The report is filtered for the criteria with subtotal lines in amount columns.
To remove a filter, click the Delete Filter icon from the Filter settings.